 Crypto
Weekly BTC Cycle Update · Week 47
BTC Down: AI Bubblenomics More Than a Correction?
In short: Bitcoin fell almost 13% and closed below its 200-week moving average, in the entry zone, one day before my cycle model’s next cycle start. Hot inflation, a December rate hike and record ETF outflows pushed it down, while stocks rose. This week, Nvidia, the Fed minutes and Anthropic’s IPO test the AI trade.
Where Bitcoin stands in its cycle
Bitcoin closed the week on Sunday at $65,315, down 12.6% from $74,738 a week earlier. That is below the 200-week moving average at $67,974, so Bitcoin is in the entry zone, one day before my cycle model’s next cycle start on 18 November.
The weekly SMI, a momentum indicator that measures where the price sits within its recent range, fell from +15 to −21. Momentum is now below 0, but it has not turned up yet.
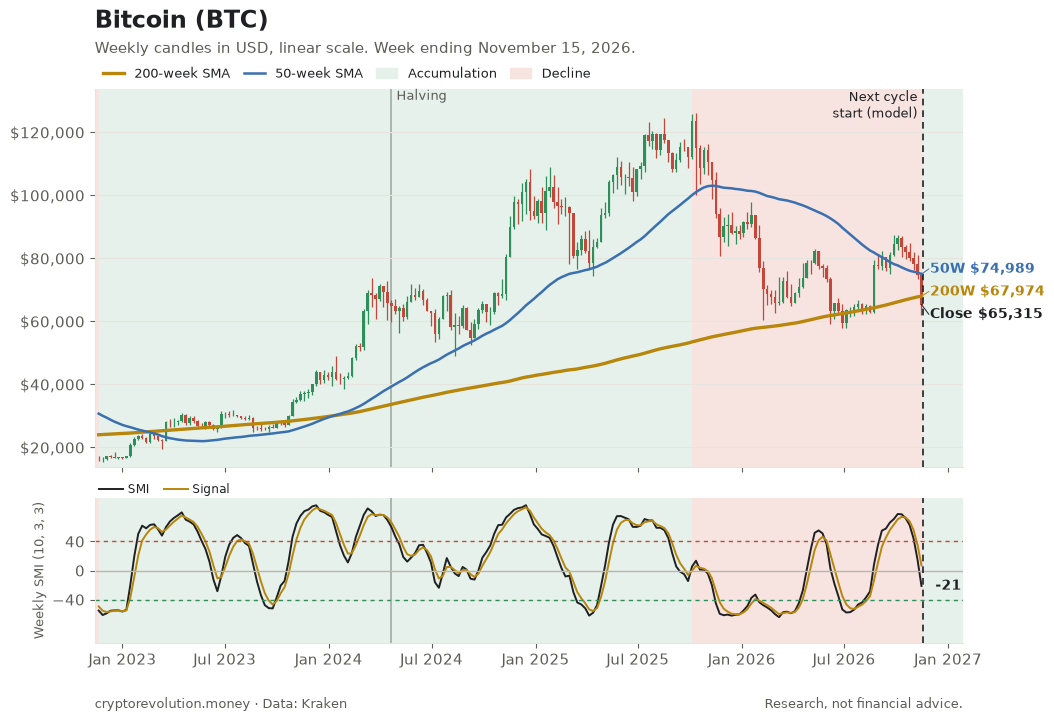
Bitcoin entry zone: reached. Bitcoin closed below the 200-week moving average at $67,974, for the first time since August. Historically, this has been a good place to buy.
The 200-week average now acts as resistance. A deeper fall is possible if markets reprice risk.
Key levels
- 50-week moving average: $74,989
- 200-week moving average: $67,974
- June low: $57,700
- Trendline in Q1 2027: $33,000 to $34,000, the crash scenario from How Low Could Bitcoin Go?
What moved markets
Crypto fell while stocks rose. The S&P 500 gained 2.5% last week, but Bitcoin lost almost 13% and touched $62,000 on Saturday. About $2 billion in leveraged long positions were liquidated, and the Fear & Greed index dropped to 13, extreme fear.
The trigger was inflation. October consumer prices rose 0.4%, more than expected, and markets now fully price a Fed rate hike in December. The 10-year Treasury yield reached 5.14% and the dollar a 19-month high. Higher rates drain liquidity, and Bitcoin feels that first.
ETF money keeps leaving. US spot Bitcoin ETFs lost $1.07 billion, their second billion-dollar week in a row, with seven straight days of outflows. For 2026 they are now about $2 billion in the red, after inflows of $21 billion in 2025 and $35 billion in 2024. Ether ETFs lost $399 million, their seventh negative week.
One more source of selling is coming. MSCI will remove Strategy and Metaplanet, the two largest Bitcoin treasury companies, from its indexes after 30 November. JPMorgan estimates about $2.8 billion in forced selling of Strategy shares.
AI bubblenomics: more than a correction?
This week tests the AI trade. Nvidia reports on 17 November, its first results since CEO Jensen Huang resigned on 11 November. The Fed minutes follow on 18 November, and on 19 November Anthropic goes public, seeking up to $64 billion. If the AI trade cracks, last week’s crash scenario comes back into play. If it holds, Bitcoin has a chance to stabilize in the entry zone.
What I am doing
From this week, what I am doing myself goes to members of the Model Portfolio, together with entry and exit zones for a core portfolio of eight tokens every week.
Get the Weekly BTC Cycle Update
Where Bitcoin is in its cycle, the key price zones and what to watch next. A 5-minute read every week, free. Plus the ebook Profitable Investing in BTC and Altcoins as PDF and EPUB.
You'll get a confirmation email first. One email a week, unsubscribe anytime. See the privacy policy.
Sources
- Zerocap: Weekly Crypto Market Wrap, 16 November 2026
- ChainCatcher: Bitcoin weekly drop of 12.7%
- The Block: Bitcoin ETFs lose $1 billion for the second week in a row
- Motley Fool: Nvidia earnings, Fed minutes and Anthropic’s IPO
- Bitcoin prices and moving averages: Kraken data, week ending November 15, 2026
This article is for educational purposes only and is not investment, tax or legal advice. It does not take your personal situation into account. Do your own research and speak to a qualified advisor before making investment decisions. The author may hold the assets discussed.