 Crypto
Weekly BTC Cycle Update · Week 46
How Low Could Bitcoin Go?
In short: The midterm elections triggered a sell-off in AI stocks that took Bitcoin below its 50-week moving average, and US spot Bitcoin ETFs had their worst week since June. From here I see two scenarios: a consolidation and a new cycle, or an AI-driven market crash that could take Bitcoin as low as $33,000 to $34,000 in Q1 2027.
Where Bitcoin stands in its cycle
Bitcoin closed the week on Sunday at $74,738, down from $78,239 a week earlier and just below its 50-week moving average at $75,490. The weekly SMI, a momentum indicator that measures where the price sits within its recent range, dropped from +44 to +15. Momentum keeps fading, but it has not yet reached the levels where bottoms usually form.
What moved markets
The midterms triggered the sharpest sell-off in AI stocks so far. On Thursday the S&P 500 fell 4.4%, its worst day since the April 2025 tariff shock, and US stocks lost about $3 trillion in value as investors priced in political pushback against data centers. Crypto followed: over $1 billion in crypto positions were liquidated, and US spot Bitcoin ETFs lost $1.28 billion over the week, turning their flows for 2026 negative.
The new Congress matters for crypto too. Senator Elizabeth Warren, a long-time critic of the industry, is expected to chair the Senate Banking Committee, which could bring tougher rules for stablecoins and crypto in general.
For a broader overview of the sell-off, watch this video from Barron News Network (opens on YouTube):

Two scenarios into Q1 2027
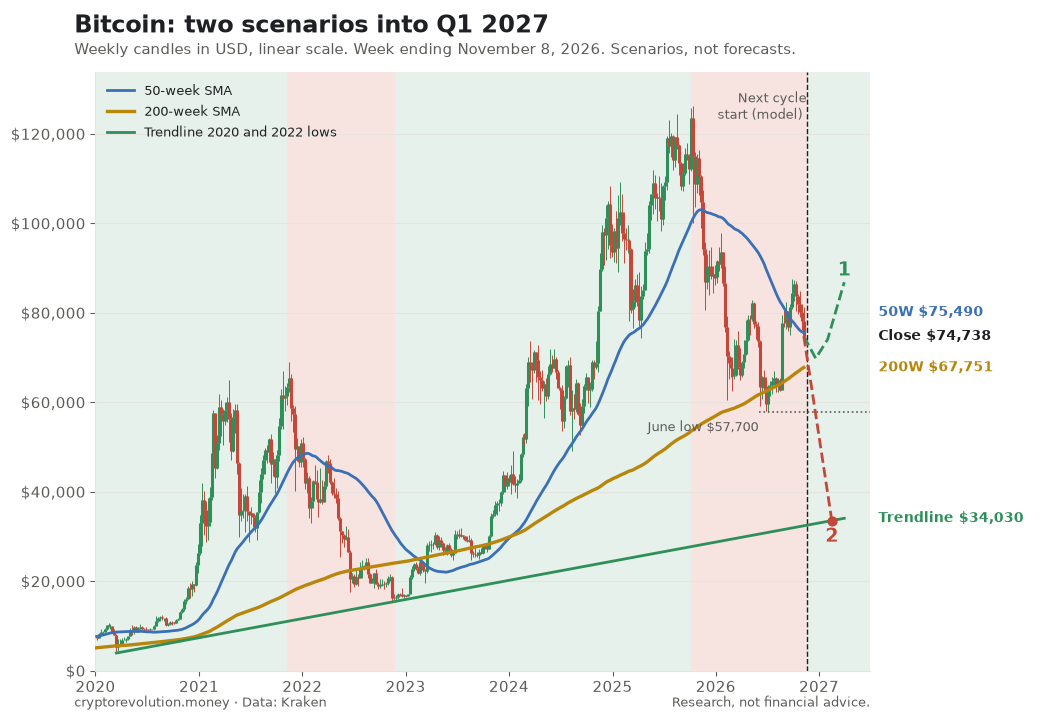
1. Consolidation, then a new cycle. Bitcoin moves sideways around the 50-week moving average and stays above the June low at $57,700. It could retest the 200-week moving average at $67,751, which is also our entry zone. It then starts its new cycle in the coming weeks.
2. The AI bubble crashes markets. If the sell-off in AI stocks turns into a broader market crash, Bitcoin could fall as low as the trendline that connects the March 2020 and November 2022 lows. That line sits at about $33,000 to $34,000 in Q1 2027.
Key levels
- 50-week moving average: $75,490
- 200-week moving average: $67,751
- June low: $57,700
- Trendline in Q1 2027: $33,000 to $34,000
Bitcoin entry zone: a weekly close below the 200-week moving average, now at $67,751. Historically, this has been a good place to buy.
What I am doing
I am waiting. A weekly close below the 50-week moving average after two weeks of ETF outflows tells me the correction is not over. I want to see the SMI fall below 0 and turn up again before I buy.
The Model Portfolio applies this method to a core portfolio of eight tokens, with entry and exit zones every week, and tracks all 16 tokens with US spot ETFs. Launch price $49 a year until 17 November.
Get the Weekly BTC Cycle Update
Where Bitcoin is in its cycle, the key price zones and what to watch next. A 5-minute read every week, free. Plus the ebook Profitable Investing in BTC and Altcoins as PDF and EPUB.
You'll get a confirmation email first. One email a week, unsubscribe anytime. See the privacy policy.
Sources
- Fortune: post-midterm rally lasted one day as chip stocks plunged
- AP via Fox19: S&P 500 sees worst day since the 2025 tariffs
- The Block: Bitcoin ETFs flip negative for 2026
- crypto.news: Bitcoin drops toward $74K as liquidations top $1 billion
- IBTimes: Warren poised to chair the Senate Banking Committee
- Barron News Network: video on the global sell-off
- Bitcoin prices, moving averages and trendline: Kraken data, week ending November 8, 2026
This article is for educational purposes only and is not investment, tax or legal advice. It does not take your personal situation into account. Do your own research and speak to a qualified advisor before making investment decisions. The author may hold the assets discussed.