 Crypto
Weekly BTC Cycle Update · Week 44
Bond Markets Are Signaling a Correction: What It Means for Bitcoin
In short: Bitcoin has rallied 46 percent from its June low, but the bond market is flashing warning signs. The riskiest corporate debt is under heavy pressure and France is testing Europe’s debt markets. If risk is repriced across markets, Bitcoin could test its 200-week moving average again before a new cycle starts.
Where Bitcoin stands in its cycle
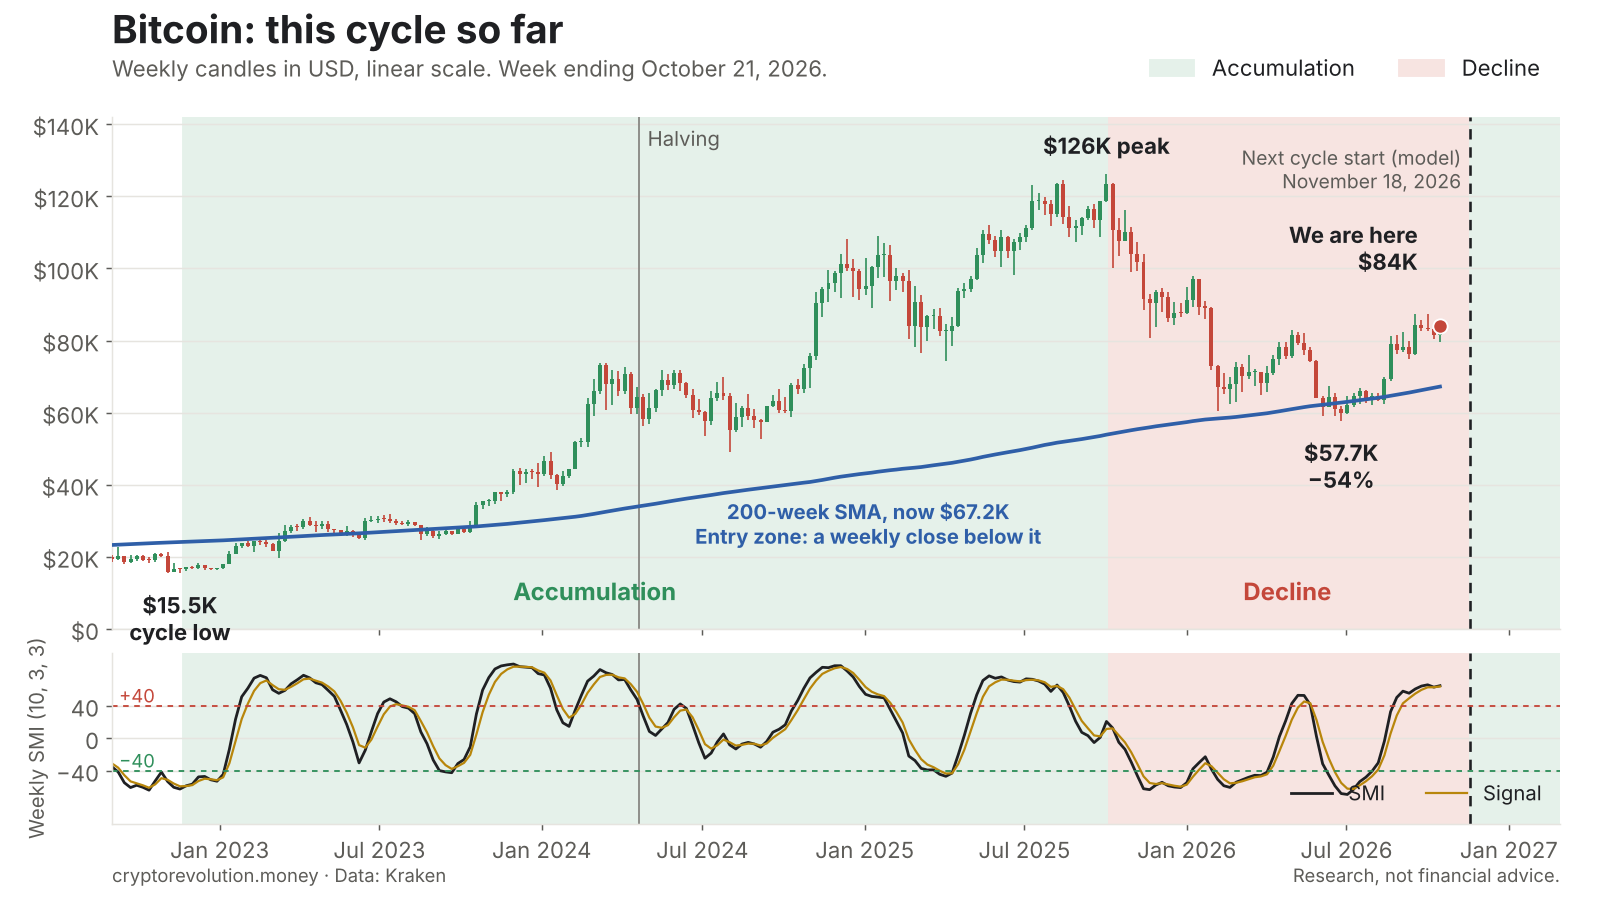
Bitcoin closed last week at $84,022, up from $81,576 the week before and 46 percent above the June low of $57,740. The weekly SMI, a momentum indicator that measures where the price sits within its recent range, is now at +65. That is above the +40 level for the third week in a row.
That is typical of a relief rally late in a decline phase, not yet the start of a new cycle, which my model puts around 18 November. It could take until January or February 2027 to build a bottom if risk is repriced in all markets.
Key levels
- Resistance: $87,000
- 200-week moving average: $67,200
Bitcoin entry zone: a weekly close below the 200-week moving average, now at $67,200. Historically, this has been a good place to buy.
Bitcoin could test it again or go even lower if markets reprice risk.
The 200-week moving average is the average weekly close of the last four years, roughly one full halving cycle. Bitcoin has touched or dipped below it near every cycle low, most recently between June and August this year. You can see it on the long-term chart on the homepage.
Working against a deeper fall, institutional money is rotating out of the Magnificent Seven and AI stocks and into Bitcoin and the leading altcoins. The weekly SMI will need to correct below 0 before we can see which force wins.
Junk bonds are cracking at the bottom
The gap between the riskiest CCC-rated bonds and BB-rated bonds is the widest since the pandemic, and one credit investor’s morning message called it a “total meltdown”. CCC yields are at their highest since 2020, deals are being pulled, and software and AI-exposed companies are under the most pressure. When the weakest borrowers struggle to refinance, it is often an early sign that risk appetite is turning.
This is the same pattern I wrote about in CoreWeave: The Needle in the AI Bubble? The debt market tends to notice trouble before the stock market does.
France could ignite a debt crisis in Europe
The French 10-year yield has risen above 5 percent for the first time since 2002, and the spread over German Bunds is above 1.7 percentage points, with the budget stuck in parliament and protests growing. The ECB meets on 29 October. If the stress spreads to other euro countries, it may have to step in, and that would bring new liquidity.
Both point to the same theme this week: markets are starting to reprice risk, beginning with the weakest borrowers.
What I am doing
I am not buying yet, because I want to see how this plays out. The recent rally broke the market structure of the decline with a higher high. Now the market needs to confirm it by staying above the June low at $57,700, while the SMI corrects and builds a healthy bottom zone.
The Model Portfolio applies this method to twelve tokens with US spot ETFs, with entry, hold and exit zones every week. Launch price $49 a year until 17 November.
Get the Weekly BTC Cycle Update
Where Bitcoin is in its cycle, the key price zones and what to watch next. A 5-minute read every week, free. Plus the ebook Profitable Investing in BTC and Altcoins as PDF and EPUB.
You'll get a confirmation email first. One email a week, unsubscribe anytime. See the privacy policy.
Sources
- The Star / Bloomberg: Total meltdown in riskiest debt jolts market
- Euronews: France’s bond drama takes centre stage ahead of ECB rate decision
- Bitcoin prices and 200-week moving average: Kraken weekly data, week ending October 21, 2026
This article is for educational purposes only and is not investment, tax or legal advice. It does not take your personal situation into account. Do your own research and speak to a qualified advisor before making investment decisions. The author may hold the assets discussed.